The E-Guide is an eight-part, modular knowledge product for ENYAQ and ELROQ. The background and complete value proposition of the E-Guide can be found in the accompanying blog post. It describes why this format was created and which user needs it addresses. The e-guide was produced entirely in two languages.
Table of Contents
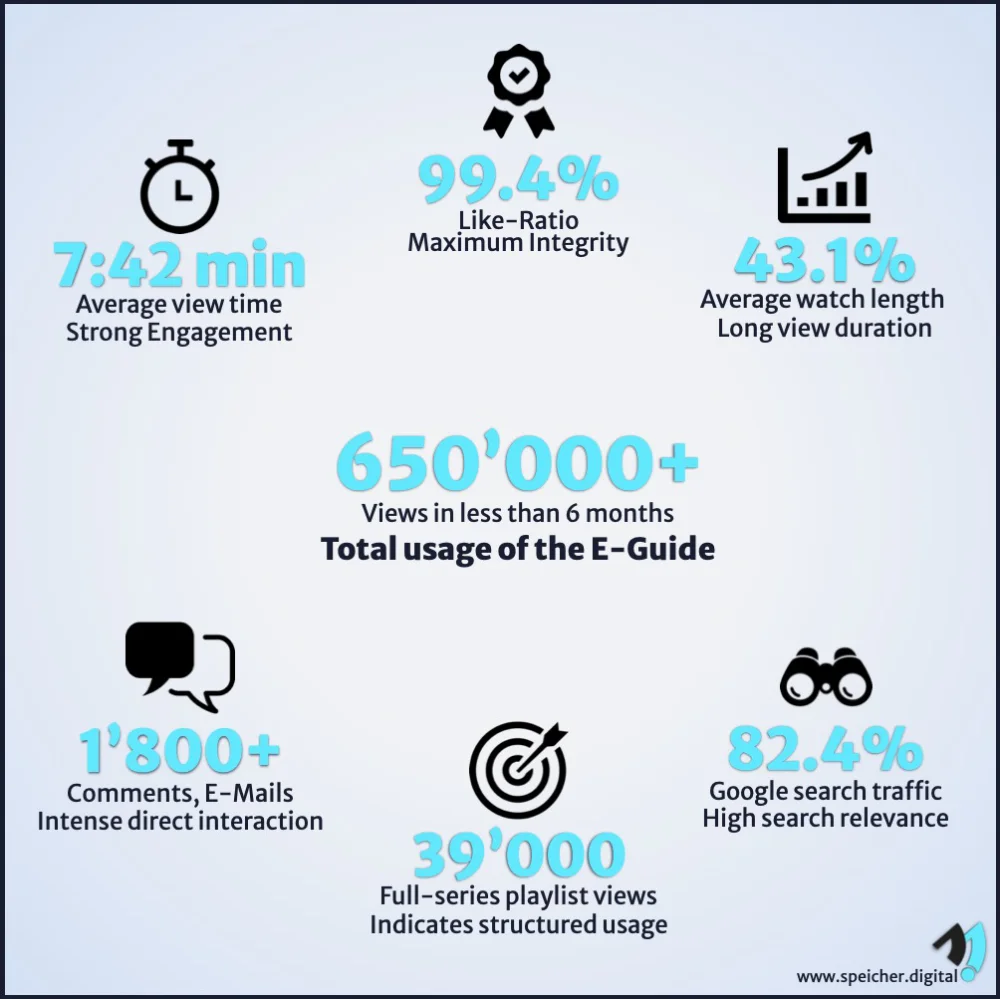
Performance data after six months
The evaluation of all eight parts over the first six months shows a clear pattern: the e-guide is one of the most stable, highest quality and best performing formats in the channel.
Like ratio (quality indicator)
- No part below 99%
- Majority of parts: 99.5%
- Individual parts reach 99.8%
- Benchmark for ‘very high approval’ on YouTube is approx. 96%
The e-guide is 3–3.5 percentage points above the upper quality band, which is unusually high for a long-form format.
Views and usage
- Cumulative > 650,000 views
- All eight parts show relatively even distribution of views (no typical series decline)
- Parts 1–8 range between 35,000 and 65,000 views per part, depending on relevance and seasonality
- Constant views over months, no short-term ‘peak and decay’
Usage corresponds to the behaviour of ‘permanently relevant’ knowledge products, not seasonal videos.
Playback duration and retention
- Average playback duration between 8 and 15 minutes, depending on the part.
- Percentage view duration consistently ~35–40%, despite some long running times.
- Several parts achieve well over 40% view time for videos of 20 minutes.
For long-form explanatory videos, this is above the platform average.
Traffic sources: depth rather than surface reach
The distribution of traffic sources shows that the e-guide does not rely on random traffic, but on active searches, recommendations by the algorithm and high relevance.
YouTube Search: High percentages per part
→ Users actively search for answers that the format offers.
YouTube Suggestions: Stable average percentages
→ Algorithm recognises content connectivity.
Browse Features (home page, subscription feed): Regular double-digit percentages
→ YouTube recommends the E-Guide as ‘reliable content’ on the home page.
External: between 10–20% depending on the part
→ The e-guide is embedded, linked and shared externally.
Google Search: up to 82.4% of external traffic
→ Google identifies the videos as the leading thematic answer.
This distribution corresponds exactly to the pattern of a high-quality, functional knowledge product that solves specific problems.
Direct engagement and behavioural impact
In addition to quantitative performance data, the e-guide shows another level of impact that cannot be derived from platform metrics. It arises from direct user interaction and demonstrable changes in decision-making and usage behaviour.
Direct engagement
In the first six months, the e-guide generated:
- 1300 comments,
- 400 emails with specific questions or feedback,
- several dozen individual conversations in private chats.
This form of user interaction is a strong indicator of relevance. Users invest time, describe their situations precisely and actively seek personal exchange. In analysis, this is referred to as intent-driven, high-intensity engagement, which only arises when content addresses real problems and is perceived as trustworthy.
Behavioural Impact
The e-guide directly influences user behaviour:
- Numerous purchasing decisions have been made or confirmed based on the information provided.
- Vehicle owner satisfaction is increasing because they are able to correctly understand functions and system limitations.
- Product retention is increasing because misinterpretations and frustrations are reduced.
This level of impact is only evident in formats that go beyond providing information and actually offer guidance. The e-guide fulfils this role: it makes complex systems usable and measurably changes behaviour in everyday life and during the decision-making phase.
Impact on users, interested parties and the market environment
The figures clearly show that the e-guide addresses three levels of impact.
Users (everyday use)
- Systematic orientation instead of fragmented individual information
- Significant reduction in uncertainty when using the vehicle
- Reproducible classification of displays and errors
- Improved use in winter, when travelling and when charging
- Less frustration thanks to transparent expectation management
Prospective buyers
- Realistic assessment of vehicles before purchase
- Comparison of marketing claims with real behaviour patterns
- Structured preparation for configuration and use
- Reduction of cognitive load in the decision-making process
Manufacturers and retailers (indirect)
- Easier vehicle handover
- Side effect: more stable customer expectations
- Better classification of known error patterns
- Systematic explanation of complex dependencies
The E-Guide structurally closes a gap that neither manufacturer communication nor classic reviews cover.
Conclusion
The E-Guide shows how a methodically developed format works in a complex technological environment:
- very high approval rating
- above-average retention
- strong search and recommendation structure
- long-term relevance
- evident benefits for users, buyers and, indirectly, OEMs
The data proves that the e-guide not only works, but is also one of the strongest content products within the entire project.
You can view all parts on YouTube here.